Debug extension
This guide explains how to install and debug the extension on your local machine for your project.
- Clone the repository:
git clone git@github.com:sweetpad-dev/sweetpad.git
- Go to the extension directory:
cd sweetpad
- Install dependencies:
npm install
- Open the project in Visual Studio Code:
code .
-
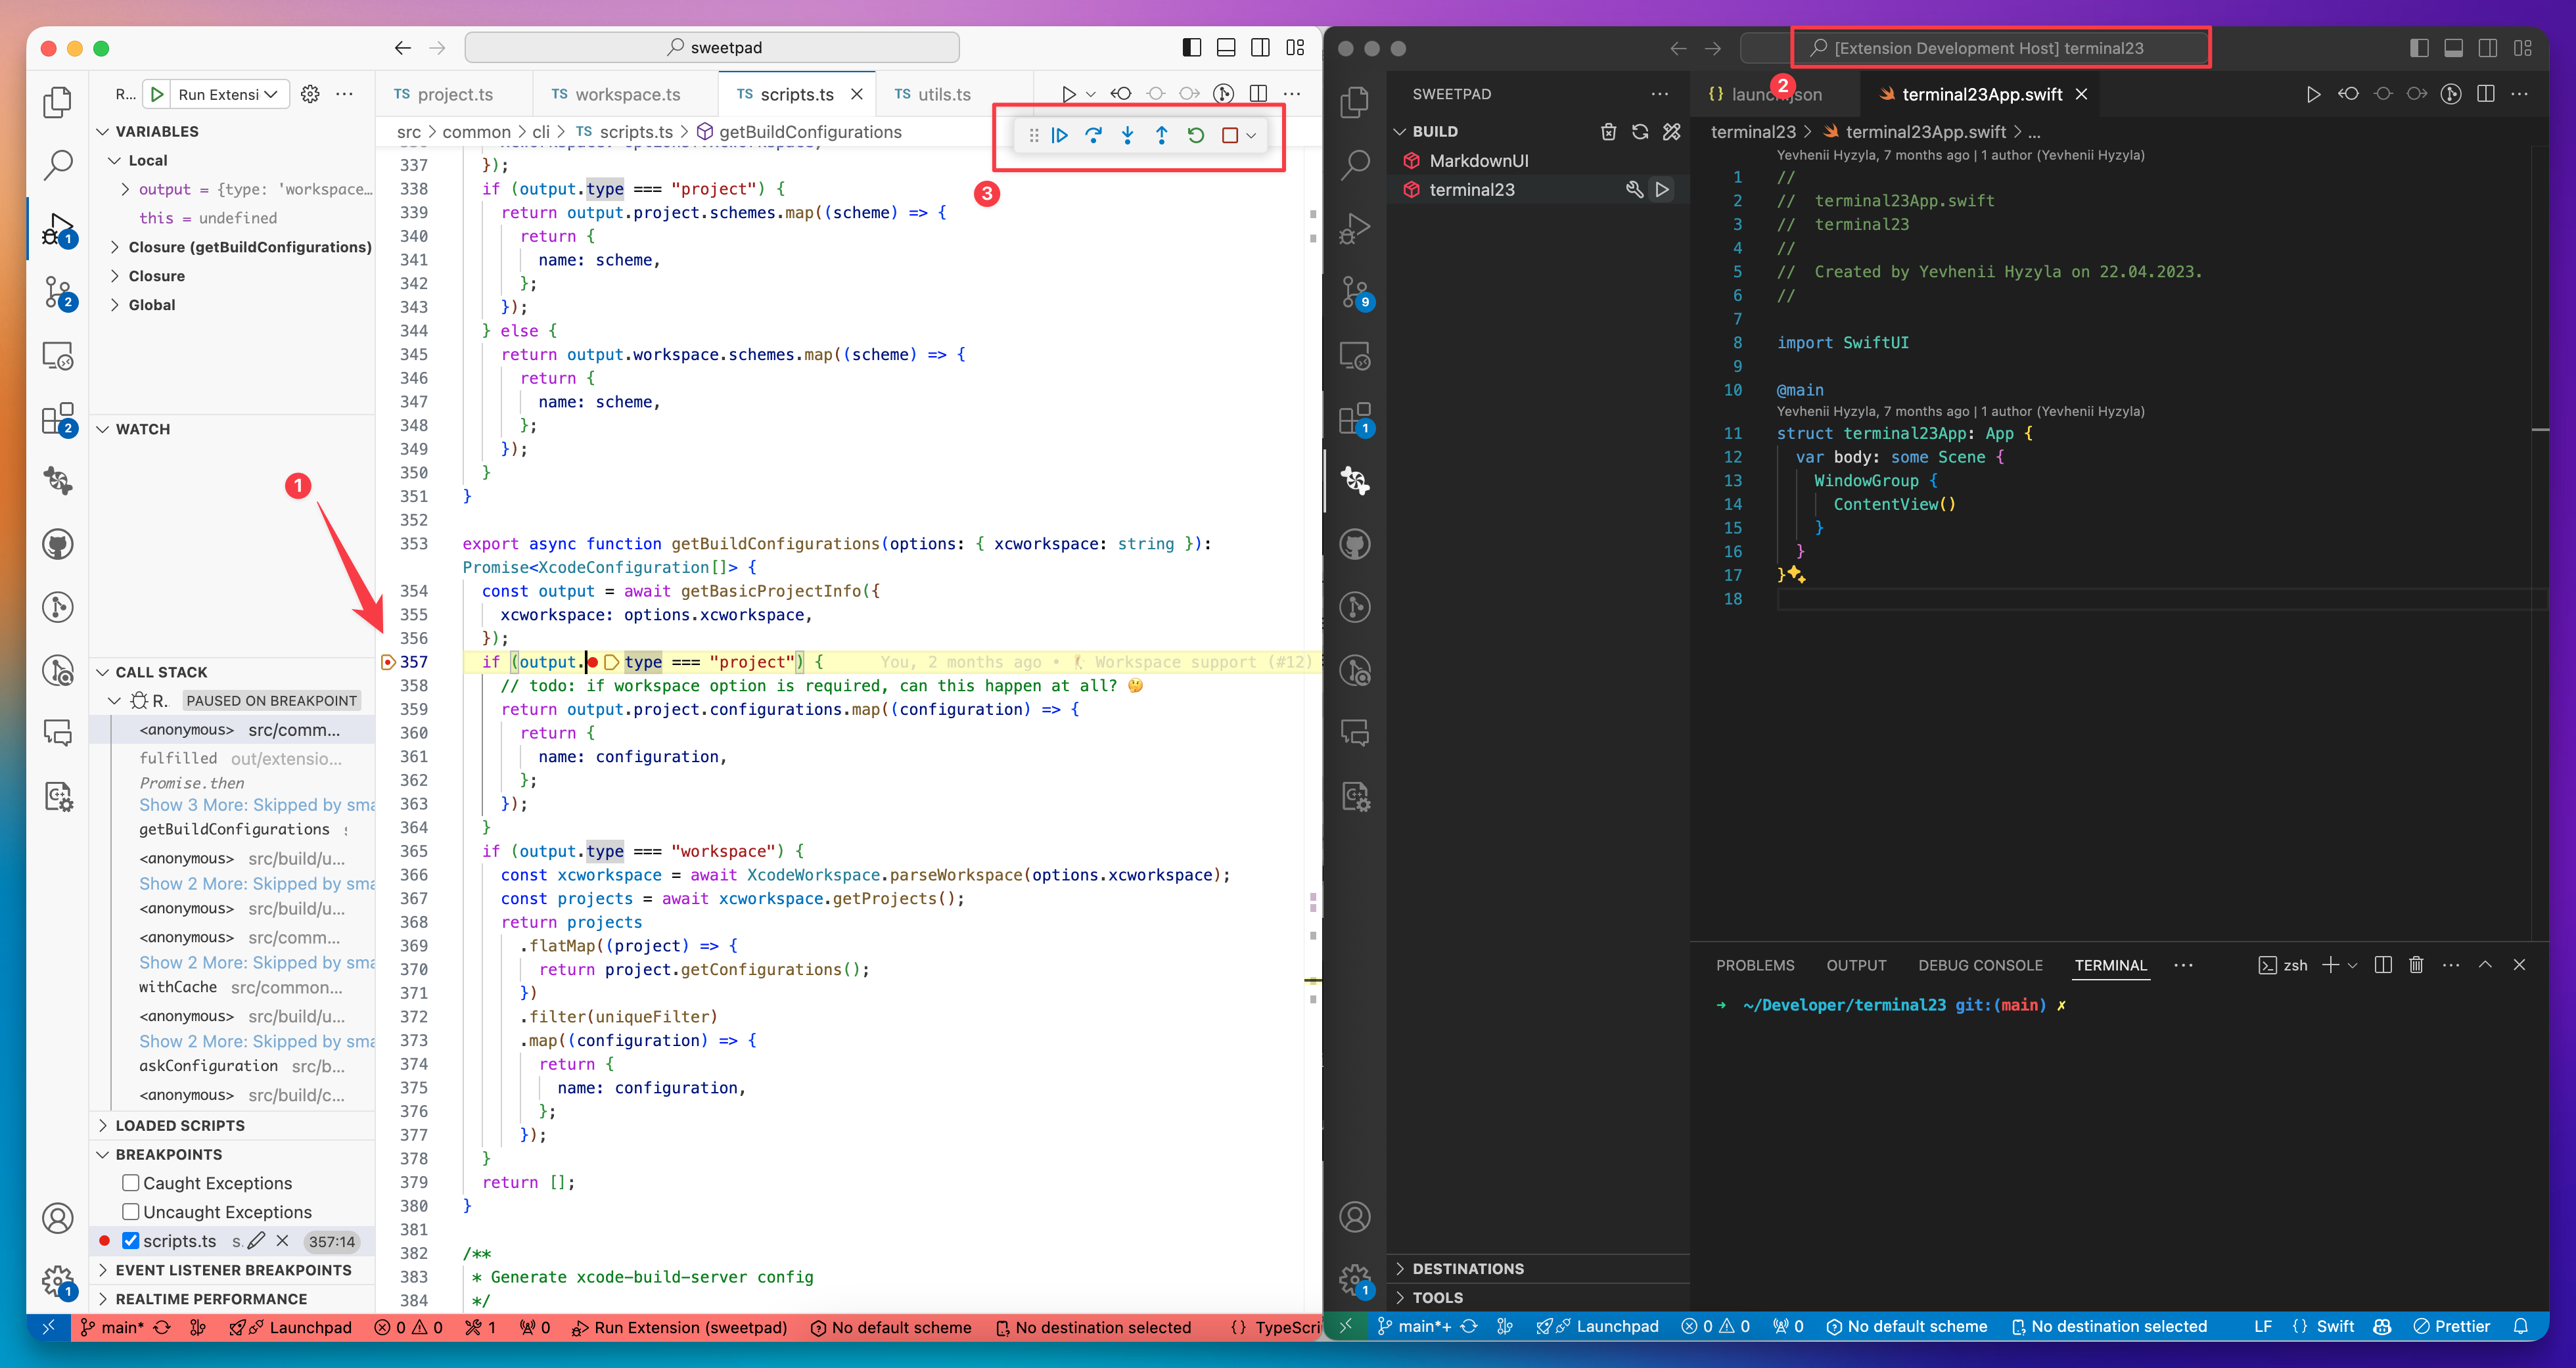
Press F5 to build and run the extension in a new window. You should now see two VSCode windows: one with the extension running and the other with the source code. The window with [Extension Development Host] in the title is where the extension is running.
-
Return to the source code window and add breakpoints to the code where you want to debug.
-
Switch to the window with the running extension and restart it by pressing Cmd+R.
-
Now, when you perform the action that triggers the breakpoint, the extension will pause, and you can inspect the variables and the call stack in the source code window.
On example below you can see:
- How breakpoints are set in the source code.
- How "[Extension Development Host]" window looks like.
- How to continue, pause, and stop the debugging session.